
Local Charts for the April 8, 2024 Solar Eclipse
Printable charts showing not only when to look up, but also what patterns to look for in the sky.
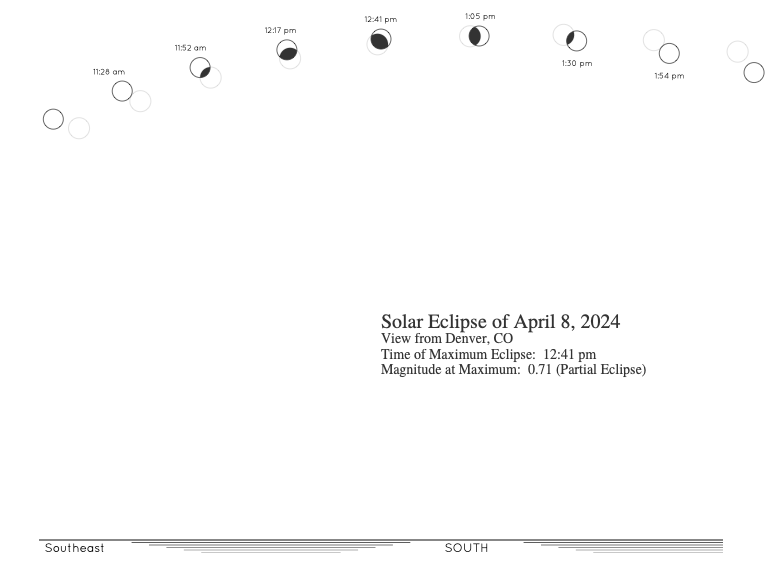
What if educators (or anybody) could print out a schedule for an eclipse? What if these schedules could also show a “map” of the sky, helping you to see an eclipse as a crossing of paths of things in the sky? What if you could print something that looks like this?
I've been experimenting with some code of my own designed to do just this, and I've come up with something that seems to work. The form below represents the input interface for an automated chart generator that can provide local charts for the upcoming April 2024 eclipse. After you click the “Make a Chart” button, you should receive a one-page printable PDF file containing your local information (assuming the eclipse is visible where you live).
If you want a chart giving the schedule for your current location (and assuming that your browser can use Location Services, which mobile devices sometimes can't), then you can just press the “Use Current Location” button to fill in your local data. You may have to grant permission to access your location, but then your latitude, longitude, and time zone should be filled in automatically. If you want to create a chart for a different location, or if your browser doesn't allow Location Services, then you will have to fill in all of the data manually.
Place Name — Whether or not you use the "Use Current Location" button, you will still have to provide your own name for the location. This can be whatever you like, and will be used in the legend of the chart.
Latitude and Longitude — You can find latitudes and longitudes for any location in Google Maps by right-clicking on that place in the map. There are also web pages of varying quality that will allow you to look up coordinates for any given street address.
Altitude — The altitude may or may not be filled in when you press the "Use Current Location" button, but it's only for fine-tuning anyway. Just enter "0" if you don't know it. If you wish to estimate it, note that the altitude should be expressed as meters above sea level.
Time Zone — For time zones in the United States, use "America/New_York" for Eastern Time, "America/Chicago" for central time, "America/Denver" for Mountain Time, and "America/Los_Angeles" for Pacific Time. You can find a more extensive list of IANA time zone names on Wikipedia. Entering the wrong time zone will simply mean that all of the event times printed on your chart will match the clocks somewhere else in the world. If you leave the Time Zone input blank, the event times will be expressed in UTC.
I originally wanted to give students blank versions that they could draw on and label themselves, so the charts may resemble school handouts, except there are no blanks. For the time being, I'm just providing fully-labeled charts. Maybe someday in the future I'll provide blank versions that children can label and color on their own.